Clean Energy Gets Dumped, but There’s Hope Ahead!

Time for a turn? When cycles align, you should pay attention.
In the realm of clean energy stock market analysis, understanding market cycles and their potential impact on future directions can be helpful for investors.
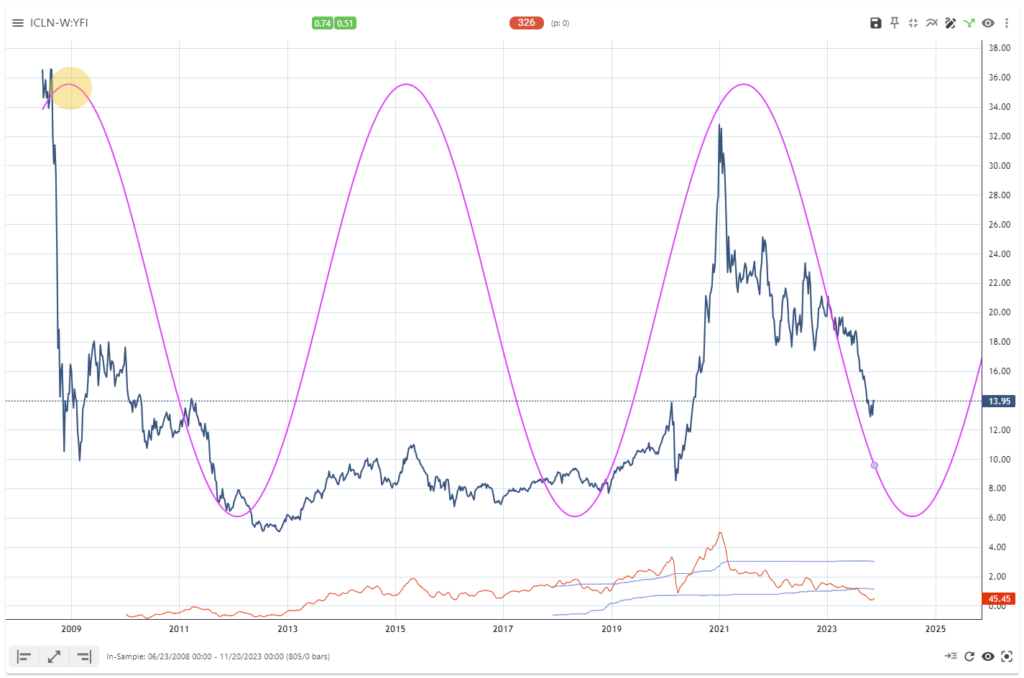
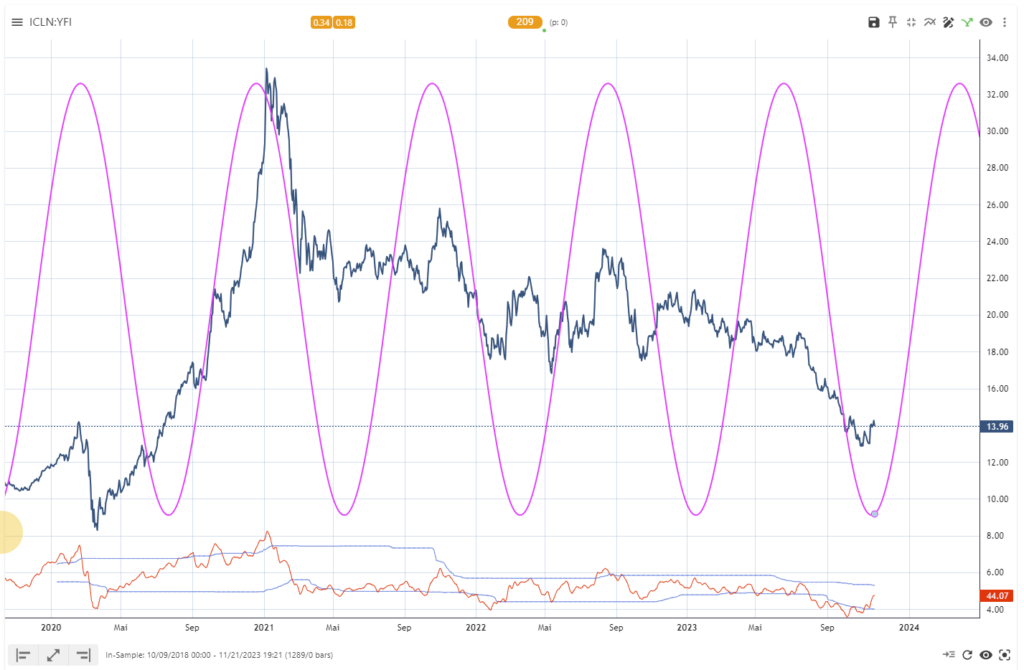
In our current analysis, we have observed that the dominant cyclic phases of weekly and daily cycles for the Clean Energy sector are coming to an end. Over the past 1-2 years, there has been a downward trend accompanied by a dominant cycle in both the long-term weekly and short-term daily periods. However, it is expected that this downward phase might now switch to an uptrend. The current weekly and daily cycles are now synchronized into an upward-trending cyclic outlook.
This potential bullish setup can be seen through the analysis of various cycles and their relationship to the cyclic-tuned technical indicator.
As cycle analysts, we are looking for timing when long- and short-term cycles align with their projections. This seems to happen right now in the context of the clean energy sector as shown in the following charts.
The first chart displays the long-term weekly cycle, which indicates a bottoming phase followed by a projected upward move.
I. Weekly Cycle – Global Clean Energy ETF

iShares Global Clean Energy ETF | weekly dominant 326w cycle | 22. Nov. 2023
The swings of the 209 days daily cycle align with the current changes in trend in this asset class.
Now, the cycles regime to read the daily cycle has changed. Up to know, the daily cycle had to be seen in the context of the longer cycle downward phase. So each time the daily cycle topped – we can see a significant downward move in the asset afterwards. As the long- and short-term cycles have aligned.
Now we need to change our view. The interesting times will come when the daily cycles model now points in the direction of the longer cycle – which now is upwards. We would look out now for opportunities to joint the upswing phase of both cycles.
Daily Cycle – Global Clean Energy ETF

iShares Global Clean Energy ETF | daily dominant cycle model | 209d | 23. Nov. 2023


Responses